今年常春藤 申请破纪录 录取创新低
世界新闻网
4/12/2022
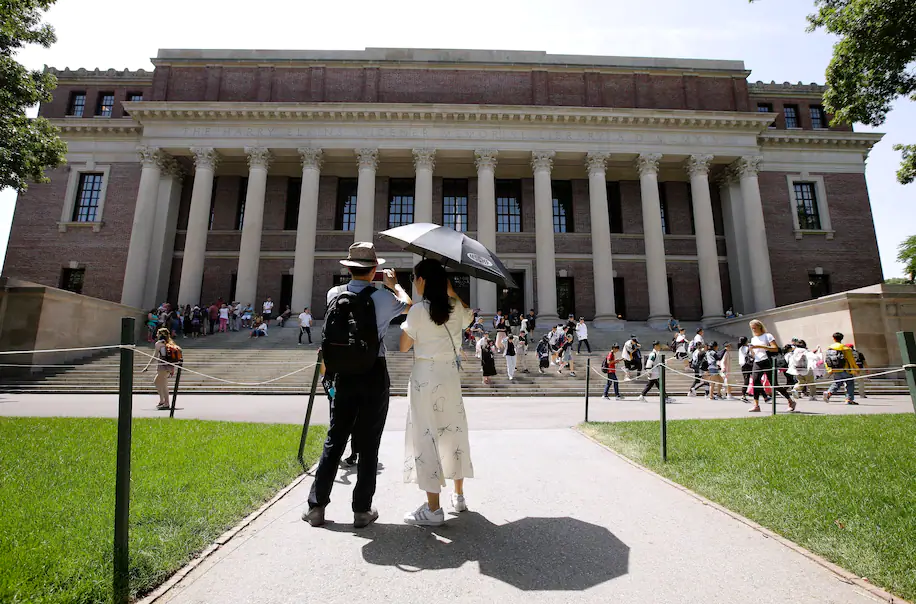
4 月初美国多数最具竞争力的私立大学已经发榜,其中哈佛大学(Harvard)亚裔学生录取率占 27.8%。由于今年可选择性提供标准考试成绩,顶尖大学的申请人数创新高;另一方面由于这些大学并没有扩大招生,因此被拒绝录取率也同样创纪录。
哈佛大学今年收到 6万1220人申请,高于去年7%;录取1954人,录取率3.19%创历史新低,令人震惊。但好消息是,年收入低于 7万5000元的家庭将免收学费、食宿费和所有费用,近四分之一的哈佛学生来自年收入低于 7万5000元的家庭。
在族裔结构上,今年哈佛新生中的白人只占40%,亚裔排名第二占 27.8%,非裔上升到15.5%,拉丁裔占 12.6%,但是,女性过半占录取人数的 54.2%。

耶鲁大学(Yale)今年有5万15人申请,录取了其中的2234人,录取率4.47%。今年的申请人数比去年成长 7%,创下耶鲁大学的新纪录。
今年宾州大学(Penn)收到约 5万5000 份申请,比两年前增加近 1万5000 人;录取了 2400人,占4.4%。布朗大学今年有5万649 人申请,同比增长 9%,录取2546人,占5.03%。达特茅斯学院(Dartmouth)收到 2万8336 份申请,比去年创纪录的总数少了21 份,但比两年前高出 33%。今年录取1767人,录取率6.2%。
但并非所有常春藤大学都公布了招生数据。哥伦比亚大学(Columbia University)、普林斯顿大学(Princeton University)及康奈尔大学(Cornell University)没有公布招生人数,部分原因是校方认为录取率太低,可能会对以后的申请者有负面影响。但是,部分补习学校通过其他管道拿到了相关数据。
招生官员说,今年顶尖大学申请人数飙升,因为疫情大流行,每所常春藤大学以及其它名校都将传统的标准化考试改为可选择性。因此,鼓励了更多学生以顶尖大学为目标。
哈佛大学招生和财务援助办公室主任菲茨西蒙斯 (William R. Fitzsimmons) 赞扬说,今年的新生在各方面都非常出色,除了在申请文档中提供的学术和课外成就之外,他们在大流行和经济挑战时期,也为他们的家庭、学校和社区做出许多贡献。
此外,常春藤联盟之外的顶级名校,今年录取率也创新低,例如,麻省理工学院(MIT) 3.96%,约翰霍普金斯大学(Johns Hopkins University)6.48%, Rice大学 8.56%,纽约大学 (NYU)12.2%,史丹福(Stanford University)没有公布录取数据。

Applications boom, admit rates plummet: Prestige college admissions get a little crazier in the pandemic
New test-optional policies drive eye-popping statistics
By Nick Anderson
4/07/2021
The chase for the Ivy League and other prestige colleges, a perennial object of global fascination, grew a few degrees more frenzied during the coronavirus pandemic as applications soared and admit rates plummeted to, in some cases, crazy-low single digits.
At 7 p.m. Eastern time Tuesday, the eight private universities identified with the brand of the climbing vine released admission decisions for the entering fall class. New test-optional policies, in effect because the coronavirus clobbered ACT and SAT testing plans, had fueled a surge in applications as students worldwide said, in effect, “Why not me?”
Everyone figured the admit shares would get even more microscopic. And they did.
| SCHOOL | APPLICATIONS | ADMIT RATE % | ADMIT RATE 2020* |
|---|---|---|---|
| Brown University | 46,568 | 5.4 | 6.9 |
| Columbia University | 60,551 | 3.7 | 6.1 |
| Cornell University | not yet available | n/a | n/a |
| Dartmouth College | 28,357 | 6.2 | 8.8 |
| Harvard University | 57,435 | 3.4 | 4.9 |
| Princeton University | 37,601 | 4.0 | 5.6 |
| University of Pennsylvania | 56,333 | 5.7 | 8.1 |
| Yale University | 46,905 | 4.6 | 6.5 |
(The 2020 rates in this chart come from preliminary releases at a comparable point in the cycle.)
The numbers come with all kinds of caveats.
First, schools aren’t done making offers. They could (and some probably will) pull often from wait lists in this highly unpredictable year. Second, many students applied to several highly selective colleges, so there was significant overlap among applicants and admitted students.
Third, and perhaps most important, these and other ultracompetitive schools represent only a tiny sliver of higher education in the United States. Many colleges, public and private, offer excellent value with a lot less admission angst.
But it is the angst that fuels the fascination. Cornell’s admissions chief recognized that last year when he announced that the university in Ithaca, N.Y., would not immediately release admit rates.
“We’re doing this because we’d like to reduce the ‘metric mania,’ ” Jonathan Burdick, vice provost for enrollment at Cornell, told the Cornell Daily Sun in March 2020. “Cornell being highly selective is not news, and the specific data for any given year doesn’t change or matter that much.”
Eventually, the rates come out through government data collection. Federal data show that for the fall 2019 entering class, the admit rate for Cornell was 11 percent. The rate has almost certainly fallen since then. Cornell’s application totals rose about a third this year.
How much the pandemic influences selective college admissions over the long term remains to be seen. The test-optional movement, which predates the pandemic, is gaining steam nationwide. Some schools are even going test-blind, meaning they don’t consider SAT or ACT scores at all.
For at least the next cycle, many will remain test-optional because this year’s high school juniors have continued to face significant educational disruptions, including uneven access to the SAT and the ACT. Without the hurdle of a test score requirement, that means application volume is likely to remain relatively steady.

Columbia’s applications were up a stunning 51 percent this year, and Harvard’s were up 42 percent. There were also double-digit increases at Brown (27 percent), Dartmouth (33 percent), Princeton (15 percent), the University of Pennsylvania (33 percent) and Yale (33 percent).
Social media was abuzz with the outcomes.
“I applied to these ivies just for the sake of applying. … Surprisingly, I wasn’t surprised lol. Rejected#Ivyday,” wrote one Twitter user who posted two denial letters.
“COMPLETELY IN SHOCK!!!! i’m so incredibly grateful and surprised and i still don’t even know what to say !!” wrote another Twitter user who posted three Ivy acceptances.
A crucial question is whether the test-optional moment will make these schools, and others like them, more diverse.
U-Penn. reported that 26 percent of its regular-decision applicants (those who did not apply for early admission) chose not to submit test scores. Overall, it said, 18 percent of its admitted students have enough financial need to qualify for Pell Grants. The previous year, U-Penn.’s estimated Pell-eligible share was 20 percent.
Harvard announced that a little more than 20 percent of its admitted students this year are Pell-eligible, and about the same share came from families in which the parents do not have a four-year college degree. Those figures, Harvard said, were up about one percentage point from the year before.
Princeton said 22 percent of its offers went to first-generation college applicants, up from 17 percent the year before. Dartmouth said first-generation students comprise 17 percent of its admitted class, a record for the school.
The challenge now is for colleges to get those students to accept the offers. The deadline for them to decide is May 3.
Source: https://www.washingtonpost.com/education/2021/04/07/admit-rates-ivy-league-pandemic-test-optional/

Top 100 – Lowest Acceptance Rates
Many students aim for admission to a prestigious college or university, but the supply of open seats often does not meet the demand from applicants. Earning admission to the schools on this list can be especially difficult. With the lowest acceptance rates among all undergraduate institutions that U.S. News surveyed, regardless of ranking category, the 100 colleges and universities listed here are among the most selective, based on the fall 2019 entering class.
| SCHOOL | LOCATION | FALL 2019 ACCEPTANCE RATE |
|---|---|---|
| Stanford University | Stanford, CA | 4% |
| Columbia University | New York, NY | 5% |
| Curtis Institute of Music | Philadelphia, PA | 5% |
| Harvard University | Cambridge, MA | 5% |
| California Institute of Technology | Pasadena, CA | 6% |
| Princeton University | Princeton, NJ | 6% |
| University of Chicago | Chicago, IL | 6% |
| Yale University | New Haven, CT | 6% |

| Alice Lloyd College | Pippa Passes, KY | 7% |
| Brown University | Providence, RI | 7% |
| Massachusetts Institute of Technology | Cambridge, MA | 7% |
| Pomona College | Claremont, CA | 7% |
| Dartmouth College | Hanover, NH | 8% |
| Duke University | Durham, NC | 8% |
| Juilliard School | New York, NY | 8% |
| United States Naval Academy | Annapolis, MD | 8% |
| University of Pennsylvania | Philadelphia, PA | 8% |
| Bowdoin College | Brunswick, ME | 9% |
| College of the Ozarks | Point Lookout, MO | 9% |
| Northwestern University | Evanston, IL | 9% |
| Rice University | Houston, TX | 9% |
| Swarthmore College | Swarthmore, PA | 9% |
| Vanderbilt University | Nashville, TN | 9% |
| Claremont McKenna College | Claremont, CA | 10% |
| Colby College | Waterville, ME | 10% |
| Johns Hopkins University | Baltimore, MD | 10% |
| United States Military Academy | West Point, NY | 10% |
| Amherst College | Amherst, MA | 11% |
| Barnard College | New York, NY | 11% |
| Cornell University | Ithaca, NY | 11% |
| United States Air Force Academy | USAF Academy, CO | 11% |
| University of Southern California | Los Angeles, CA | 11% |
| Bates College | Lewiston, ME | 12% |
| University of California–Los Angeles | Los Angeles, CA | 12% |
| Tulane University | New Orleans, LA | 13% |
| Williams College | Williamstown, MA | 13% |
| Colorado College | Colorado Springs, CO | 14% |
| Georgetown University | Washington, DC | 14% |
| Harvey Mudd College | Claremont, CA | 14% |
| Jarvis Christian College | Hawkins, TX | 14% |
| Limestone University | Gaffney, SC | 14% |
| Ottawa University | Ottawa, KS | 14% |
| Pitzer College | Claremont, CA | 14% |
| Washington University in St. Louis | St. Louis, MO | 14% |
| Bacone College | Muskogee, OK | 15% |
| Carnegie Mellon University | Pittsburgh, PA | 15% |
| Middlebury College | Middlebury, VT | 15% |
| Tufts University | Medford, MA | 15% |
| United States Merchant Marine Academy | Kings Point, NY | 15% |
| Cooper Union for the Advancement of Science and Art | New York, NY | 16% |
| Emory University | Atlanta, GA | 16% |
| Franklin W. Olin College of Engineering | Needham, MA | 16% |
| Hamilton College | Clinton, NY | 16% |
| Haverford College | Haverford, PA | 16% |
| New York University | New York, NY | 16% |
| University of Notre Dame | Notre Dame, IN | 16% |
| Wesleyan University | Middletown, CT | 16% |
| University of California–Berkeley | Berkeley, CA | 17% |
| Davidson College | Davidson, NC | 18% |
| Laboure College | Milton, MA | 18% |
| Northeastern University | Boston, MA | 18% |
| Boston University | Boston, MA | 19% |
| Carleton College | Northfield, MN | 19% |
| Texas Wesleyan University | Fort Worth, TX | 19% |
| Washington and Lee University | Lexington, VA | 19% |
| Charles R. Drew University of Medicine and Science | Los Angeles, CA | 20% |
| United States Coast Guard Academy | New London, CT | 20% |

| Georgia Institute of Technology | Atlanta, GA | 21% |
| New York School of Interior Design | New York, NY | 22% |
| Wellesley College | Wellesley, MA | 22% |
| California Institute of the Arts | Valencia, CA | 23% |
| Colgate University | Hamilton, NY | 23% |
| Grinnell College | Grinnell, IA | 23% |
| University of Michigan–Ann Arbor | Ann Arbor, MI | 23% |
| University of North Carolina–Chapel Hill | Chapel Hill, NC | 23% |
| University of Virginia | Charlottesville, VA | 24% |
| Vassar College | Poughkeepsie, NY | 24% |
| Webb Institute | Glen Cove, NY | 24% |
| Art Academy of Cincinnati | Cincinnati, OH | 25% |
| Arkansas Baptist College | Little Rock, AR | 26% |
| Babson College | Babson Park, MA | 26% |
| Inter American University of Puerto Rico–Arecibo | Arecibo, PR | 26% |
| Inter American University of Puerto Rico–Metropolitan Campus | San Juan, PR | 26% |
| Rhode Island School of Design | Providence, RI | 26% |
| Boston College | Chestnut Hill, MA | 27% |
| Case Western Reserve University | Cleveland, OH | 27% |
| Inter American University of Puerto Rico–Bayamon | Bayamon, PR | 27% |
| Kettering College | Kettering, OH | 27% |
| University of California–Irvine | Irvine, CA | 27% |
| University of Miami | Coral Gables, FL | 27% |
| California Polytechnic State University–San Luis Obispo | San Luis Obispo, CA | 28% |
| University of Puerto Rico–Aguadilla | Aguadilla, PR | 28% |
| University of Richmond | Univ. of Richmond, VA | 28% |
| Villanova University | Villanova, PA | 28% |
| Denison University | Granville, OH | 29% |
| Oklahoma State University Institute of Technology–Okmulgee | Okmulgee, OK | 29% |
| Trinity University | San Antonio, TX | 29% |
| University of North Carolina School of the Arts | Winston-Salem, NC | 29% |
| Plaza College | Forest Hills, NY | 30% |
| University of California–Santa Barbara | Santa Barbara, CA | 30% |
Source: https://www.usnews.com/best-colleges/rankings/lowest-acceptance-rate

A Great Admissions Year, for Some
For the most selective colleges, 2021 is pretty perfect in admissions. For everyone else, that remains to be seen.
By Scott Jaschik
4/07/2021
Not all of the most selective colleges have given out their acceptance letters yet — the Ivy League will announce Tuesday evening — but the trends are already clear. The pandemic has not hurt the colleges in admissions; it’s helped them. It has sent them new applicants, new minority and first-generation applicants, and new attention. The results are starting to come in — and they suggest that the most selective private and public institutions are going to have a very good year. What that means for all the other colleges remains to be seen.
Colby College admitted only 8 percent of the (record) 15,857 students who applied, down from 10 percent last year and 13 percent the year before. Despite the popularity of test-optional admissions (which Colby had as a policy before the pandemic), Colby received students with great test scores: the median ACT score is 34, and the median SAT score is 1520. Thirty-five percent of American students are people of color, and 11 percent are international students.
“Obviously, this had been the most challenging admissions year we have ever had, but we had a really strong strategy,” said Matt Proto, vice president for enrollment and communications.
While Colby has been open to students this academic year, it has barred all visitors, meaning that admissions had to do all of its recruiting remotely. Proto said he found that the college was able to make more “visits” to high schools because they were virtual visits.
A key for Colby has been a financial aid program that expects no parental contribution for families with incomes of up to $65,000. “You’ve got to have a robust commitment to aid,” Proto said.
Now the key is to get students to enroll. Proto said the college will stream current classes online so newly admitted students can watch. He’s hopeful that and other virtual interactions will get the students to enroll.
Colby is not alone. Williams College also admitted 8 percent of students this year, out of 12,500 applicants. The admit rate is down from 12 percent two years ago, the last class admitted before the pandemic.
Swarthmore College also had an 8 percent admit rate this year, down from 9 percent last year.
And if 8 percent seems impressive, consider the Massachusetts Institute of Technology, which admitted just 4 percent of the 33,240 students who applied. That is a 66 percent increase in applicants in one year. The admit rate fell from 7 percent.
Larger universities tend to have slightly higher admit rates, but they are going down.
The University of Notre Dame admitted 1,771 students last week and earlier admitted 1,673 through a restrictive early program. The admit rate fell to a new record of 15 percent.
Emory University’s admit rate (for Emory College) fell from 19 percent to 13 percent.
Among public flagship universities, there is also more competition to get in. The University of Virginia saw applications increase from 41,000 to 48,000 — and offered admission to 21 percent.
At the University of Georgia, 39 percent of applicants were admitted this year, down from 46 percent last year.
Jim Bock, vice president and dean of admissions at Swarthmore, said his college received 12 percent more applications this year than last.
He noted that despite the way the national press denigrates a liberal arts education, top liberal arts colleges continue to attract students.
In terms of changes Swarthmore made, he pointed to a fly-in program that the college typically does for 75 to 150 disadvantaged students. This year the program was virtual, and 200 students attended. He said the college needs to look at the results (how many of the students actually enroll?) and should think about changes in the fly-in program next year.
Swarthmore also went test optional this year for the first time. Bock said the college uses “holistic review” — generally, not just this year — so testing being left off some applicants’ forms was not a huge change. Nonetheless, he said Swarthmore would study the results. (The college will be test optional for at least one more year.)
At Emory, John F. Latting, associate vice provost and dean of admission, said there are fears that getting too selective could scare off applicants. “In most of America, it raises the intimidation factor,” he said. “And that’s not what we want.”
Still, he said, Emory is planning for the next few years 5 percent increase each year in applications, with no increase in enrollment.
Emory had to do many things differently this year (beyond being test optional).
The university published a story about the differences in admissions, including:
- “Pass/fail grades last spring: Many schools around the world went to a ‘pass/fail’ grading system for the spring semester of the junior year when nearly all schools transitioned to virtual learning. This impacts a student’s grade-point average (GPA).
- “Virtual learning this year: For many school communities, virtual or hybrid learning has continued in some form this academic year, changing the nature of how students learn and are tested on their knowledge. This also impacts a student’s GPA.
- “Extracurricular activities and job changes: Many academic competitions, sports tournaments, internships, volunteer opportunities and part-time jobs were canceled last year and this year or may have only been offered virtually, shifting the traditional activities a student may participate in during their senior year.
- “Letters of recommendation from teachers: Due to the virtual learning environment, many students shared that their teachers didn’t know them as well, not having that face-to-face relationship.”
Plus the staff, Latting said, was meeting entirely via Zoom.
Over all, the class admitted has more students from underrepresented backgrounds, more first-generation students, more undocumented students, more DACA students, more (economically) poor students and more students from Georgia and the Southeast.
Mark E. Butt, director of undergraduate selection at Emory, said, “We doubled down on training for admissions.” With so many things not in the file, “we wanted to make sure we understood the student voice in the file,” he said.
At the University of Georgia, Rahul Shrivastav, the university’s vice president for instruction (who oversees admissions), described the year as “chaotic and unpredictable.”
Applications were up 40 percent, although Shrivastav estimates that about half of the gains are because the university joined the Common Application this year. He also guessed that some of the gains are due to being test optional. (That decision was made by the University System of Georgia.)
“We’re very pleased with where we are,” he said. “But it will be a long time until we sleep easy.”
What About Everyone Else?
Robert J. Massa, principal and co-founder of Enrollment Intelligence Now, said via email that the numbers are indeed good for the more selective colleges and universities. But he said, “We need to remember that although there was an 11 percent increase in applications submitted through the Common App, there was a less than 2 percent increase in the number of students applying. For the institutions with brand recognition, that meant record numbers of applications in the wake of COVID-related test optional policies. Yields will be lower and waitlist activity will likely be high, with — pardon the expression — a ‘trickle down’ impact on many less selective colleges and universities. I would guess that waitlists at institutions with admit rates in the single digits will hit record levels.”
He added that “this does not portend well for lesser selective schools admitting, for example, 40 percent of their applicants vs 4 percent, not to mention those admitting 80 percent. Most of these schools did not receive record numbers of applicants, are admitting a higher percentage in order to enroll the class, have small or no waitlists, and will be subject to waitlist decisions of schools further up on the prestige scale. It is not a pretty picture.”
Christine Chu, an IvyWise college admissions counselor and former assistant director of admissions at Yale and Georgetown Universities, said she was “not too surprised” by the good numbers at most top colleges. She noted the Common App figures as well.
She has some hopes for the colleges that are not as competitive in admissions if — and this is a big if — the economy improves. But she said that remains to be seen.
Aviva Legatt, author of Get Real and Get In (St. Martin’s Griffin), and founder of Ivy Insight (a college consulting service), said via email, “‘Good’ admissions results (‘good’ defined as an increase in selectivity) means in a decrease in college access and choice for students. The test-optional movement, while being hailed as a pillar of access (and I acknowledge that it can help low income and minority students because the test has been shown in multiple studies to be biased against this population), the test-optional policy is misleading and unhelpful for the vast majority of applicants (only 44 percent submitted scores according to Common App, which means that most people did not take and/or send in their standardized test scores).”
She added, “It’s another case of the rich institutions getting richer. I truly hope there is more honesty and transparency in the 2021-22 admissions cycle.”
Source: https://www.insidehighered.com/admissions/article/2021/04/05/top-colleges-2021-great-year-admissions