

美国人平均220万元净资产可算富有 加州要求远高于此
世界新闻网
7/03/2022

根据全美最新的一项调查显示,在美国部分地区,若拥有数百万元净资产,只能算是过上所谓「舒适」(comfortable)的生活,而非富有(wealthy),因为是否富有具体取决于你住在美国哪里。而在加州,代表富有的净资产的门槛比别的大都会区都高。
金融服务公司嘉信理财集团(Charles Schwab)最新公布的年度现代财富调查(Modern Wealth Survey)报告,通过分析全美12个最大的都会区的调查结果,发现美国人平均需要拥有220万元的净资产,才能被视为「富有」(wealthy)。而在上一年,这个数字是190万元。
这项在线调查于 2 月进行,共有 1000 名 21 至 75 岁的美国人回答调查,显示人们不仅认为他们需要比 2021 年(190 万元)更多的钱才能被视为富有,而且他们需要更多的是感觉他们也有稳固的财务基础。

有趣的是调查结果显示,美国人获得财务舒适所需的平均金额,竟比五年前显著下降。 2018 年,获得金钱满足所需的平均金额为 140 万元,但到 2021 年,仅为 62万4000元,今年则飙升至 77万4000元。专家说,这可能是因为人们在经历了新冠大流行之后,学会了调整自己的生活方式和财务前景。
2022年的财富调查报告显示,在南加州地区(调查将洛杉矶和圣地牙哥归为一个区),被视为富有的净资产是390万元,这在此次调查中为第二高的数字,仅次于旧金山(San Francisco);旧金山被视为富有的净资产是510万元。
2022年家庭拥有多少净资产,才能被视为富有的各大都会区的排名依次是:旧金山510万元,南加州(洛杉矶、圣地牙哥)390万元,纽约市340万元,华盛顿特区330万元,西雅图320万元,凤凰城270万元,波士顿270万元,达拉斯260万元,休士顿260万元,亚特兰大250万元,芝加哥250万元,丹佛230万元。

Fairfax County, Vienna Real Estate Taxes Over Last 40 Years
By David Swink
7/02/2022
This FCTA board member has lived in the same southwest Vienna rambler since Dec 1975 — with no improvements made which would alter its accessed value for tax purposes. So my home can serve as a baseline for judging the actual growth of real estate taxes in both Fairfax County and Town of Vienna for the period from 1976 onward.
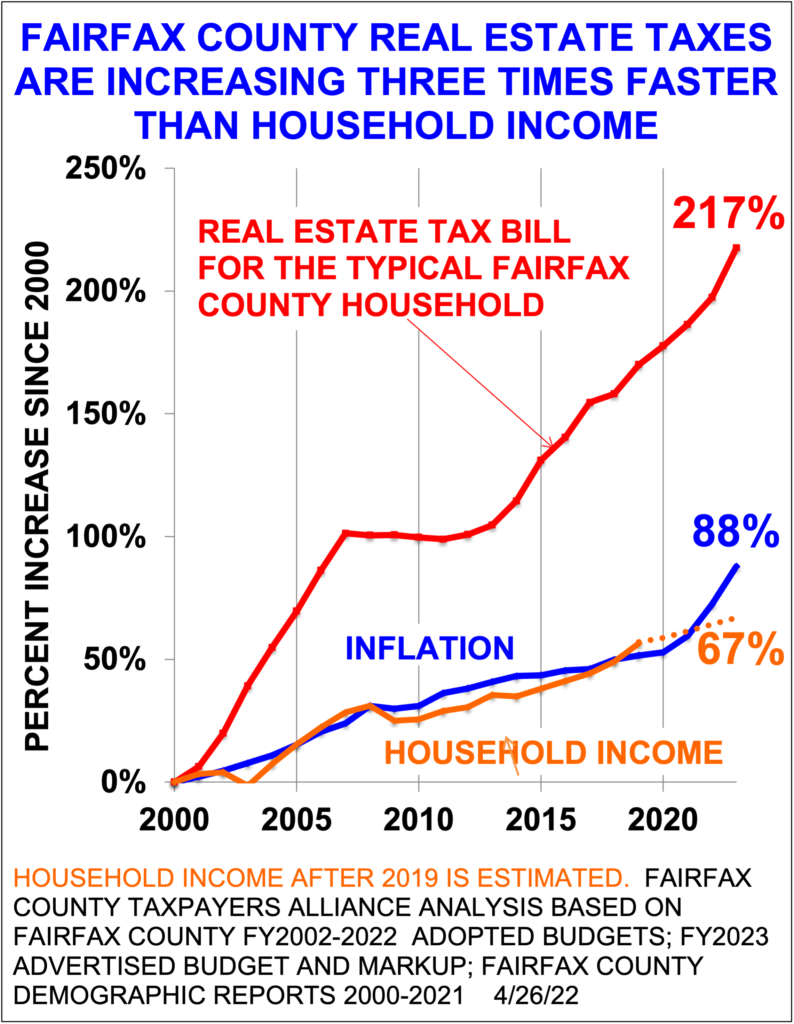
We’re all familiar with FCTA’s graph of Fairfax County real estate tax increases since FY2000. But here is raw data going back another 25 years — in actual dollars (not noting inflation).

A column is provided showing the County real estate tax percent increase from the previous year. Another column shows Vienna’s real estate tax as a percentage of the county’s, to see if Vienna’s numbers track with those of the county. So what does one notice? Even without a graph, one can deduce the following:
- Both Fairfax County and Vienna taxes “took off” after year 2000, leveled during the Great Recession, and are now back on full throttle.
- The Vienna percentage is fairly consistently in the low-to-mid 20’s, and thus seems more tied to county increases than to actual need.
- Oddly, the raw tax increase (not adjusted for inflation) from 1976 to 2013 is precisely a factor of 6.18 for both the county and Vienna.
Numbers for future years will be added to the table as they become available. Also, information such as the political make-up of the Fairfax County Board of Supervisors for each period may be added. Enjoy.

客服电话:1 (888) 666-7723
客服邮箱:customerservice@huarenstore.com

独立日提前购,22款风靡华人圈的厨房小家电特惠推荐,速来选购!
 BOS Chairman   Year  Fx Co Tax  Yr-Yr  Vienna Tax  Vn/Fx
  Jack Herrity-R 1976    $821.72   -       $170.01   20.69%
          "      1977    $857.91  +4.44%   $177.50   20.69%
          "      1978    $872.97  +1.76%   $175.66   20.12%
          "      1979    $884.27  +1.29%   $178.00   20.13%
          "      1980    $980.98 +10.94%   $197.47   20.13%
          "      1981   $1077.23  +9.81%   $235.42   21.85%
          "      1982   $1164.02  +8.06%   $261.31   22.45%
          "      1983   $1164.02   0       $261.31   22.45%
          "      1984   $1217.13  +4.56%   $275.10   22.60%
          "      1985   $1216.67  -0.04%   $288.85   23.74%
          "      1986   $1232.69  +1.32%   $292.19   23.70%
          "      1987   $1354.12  +9.85%   $318.01   23.48%
  Audrey Moore-D 1988   $1554.41 +14.79%   $358.71   23.08%
          "      1989   $1752.93 +14.79%   $412.45   23.53%
          "      1990   $1913.03  +9.13%   $482.57   25.23%
          "      1991   $1779.11  -7.00%   $464.81   26.13%
     Tom Davis-R 1992   $1826.46  +2.66%   $471.23   25.80%
          "      1993   $1824.27  -0.12%   $471.23   25.83%
          "      1994   $1824.27   0       $471.23   25.83%
   Kate Hanley-D 1995   $1886.98  +3.44%   $487.43   25.80%
          "      1996   $2000.07  +5.99%   $487.43   24.37%
          "      1997   $1998.44  -0.08%   $503.67   25.20%
          "      1998   $1998.44   0       $503.67   25.20%
          "      1999   $1998.44   0       $503.67   25.20%
          "      2000   $2123.17  +6.24%   $534.67   25.18%
          "      2001   $2441.63 +15.00%   $595.04   24.37%
          "      2002   $2955.38 +21.04%   $695.52   23.53%
          "      2003   $3185.20  +7.78%   $754.46   23.69%
Gerry Connolly-D 2004   $3413.19  +7.16%   $799.73   23.43%
          "      2005   $3753.75  +9.98%   $825.00   21.98%
          "      2006   $4281.44 +14.07%   $894.73   20.90%
          "      2007   $4281.44   0       $959.12   22.40%
          "      2008   $4425.59  +3.37%  $1004.77   22.70%
 Sharon Bulova-D 2009   $4396.65  -0.65%   $958.76   21.81%
          "      2010   $4294.60  -2.32%   $950.56   22.13%
          "      2011   $4690.11  +9.21%  $1045.56   22.29%
          "      2012   $4658.44  -0.68%  $1029.02   22.09%
          "      2013   $5080.52  +9.06%  $1051.02   20.69%
          "      2014   $5547.46  +9.19%  $1139.88   20.55%
          "      2015   $5783.11  +4.25%  $1165.95   20.16%
          "      2016   $6243.39  +7.96%  $1212.57   19.42%
          "      2017   $6422.76  +2.87%  $1244.72   19.38%
          "      2018   $6837.56  +6.46%  $1299.92   19.01%
          "      2019   $6984.07  +2.14%  $1327.77   19.01%
    Jeff McKay-D 2020   $7159.35  +2.51%  $1361.09   19.01%
          "      2021   $7452.66  +4.10%  $1413.05   18.96%
          "      2022   $7812.16  +4.82%  $1400.52   17.93%
— David Swink, FCTA board member / Updated 2022-07-02