Fairfax County, Vienna Real Estate Taxes Over Last 40 Years
By David Swink
7/02/2022
This FCTA board member has lived in the same southwest Vienna rambler since Dec 1975 — with no improvements made which would alter its accessed value for tax purposes. So my home can serve as a baseline for judging the actual growth of real estate taxes in both Fairfax County and Town of Vienna for the period from 1976 onward.

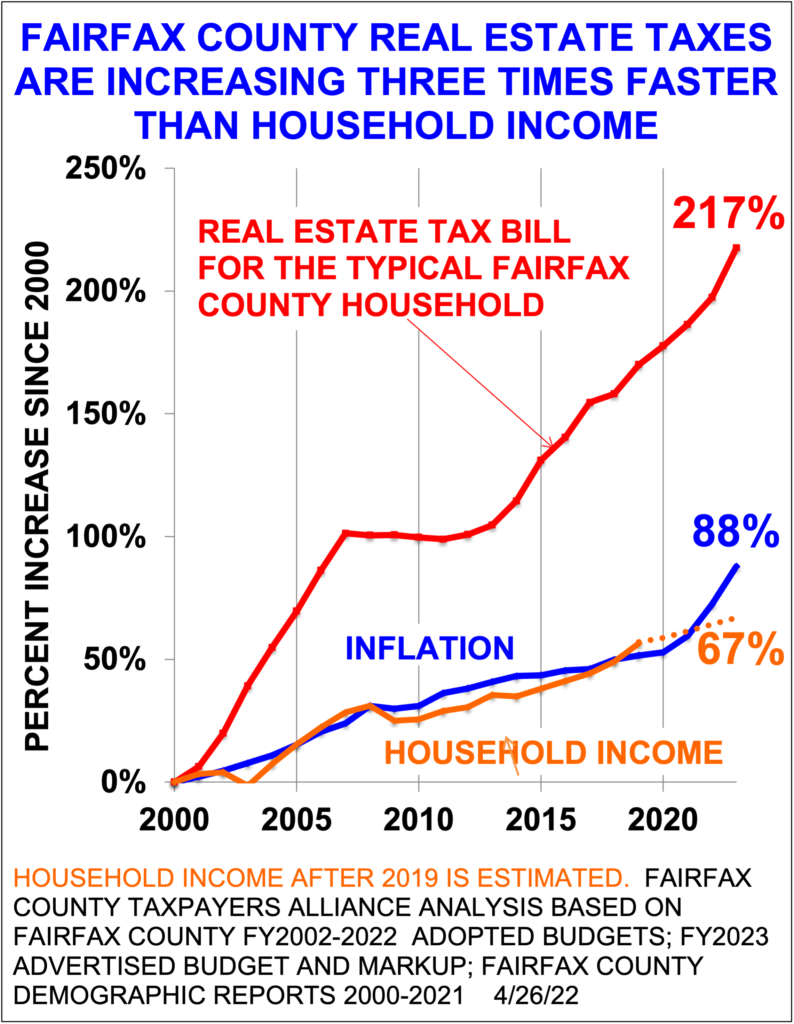
We’re all familiar with FCTA’s graph of Fairfax County real estate tax increases since FY2000. But here is raw data going back another 25 years — in actual dollars (not noting inflation).

A column is provided showing the County real estate tax percent increase from the previous year. Another column shows Vienna’s real estate tax as a percentage of the county’s, to see if Vienna’s numbers track with those of the county. So what does one notice? Even without a graph, one can deduce the following:
- Both Fairfax County and Vienna taxes “took off” after year 2000, leveled during the Great Recession, and are now back on full throttle.
- The Vienna percentage is fairly consistently in the low-to-mid 20’s, and thus seems more tied to county increases than to actual need.
- Oddly, the raw tax increase (not adjusted for inflation) from 1976 to 2013 is precisely a factor of 6.18 for both the county and Vienna.
Numbers for future years will be added to the table as they become available. Also, information such as the political make-up of the Fairfax County Board of Supervisors for each period may be added. Enjoy.
客服电话:1 (888) 666-7723
客服邮箱:customerservice@huarenstore.com

独立日提前购,22款风靡华人圈的厨房小家电特惠推荐,速来选购!
 BOS Chairman   Year  Fx Co Tax  Yr-Yr  Vienna Tax  Vn/Fx
  Jack Herrity-R 1976    $821.72   -       $170.01   20.69%
          "      1977    $857.91  +4.44%   $177.50   20.69%
          "      1978    $872.97  +1.76%   $175.66   20.12%
          "      1979    $884.27  +1.29%   $178.00   20.13%
          "      1980    $980.98 +10.94%   $197.47   20.13%
          "      1981   $1077.23  +9.81%   $235.42   21.85%
          "      1982   $1164.02  +8.06%   $261.31   22.45%
          "      1983   $1164.02   0       $261.31   22.45%
          "      1984   $1217.13  +4.56%   $275.10   22.60%
          "      1985   $1216.67  -0.04%   $288.85   23.74%
          "      1986   $1232.69  +1.32%   $292.19   23.70%
          "      1987   $1354.12  +9.85%   $318.01   23.48%
  Audrey Moore-D 1988   $1554.41 +14.79%   $358.71   23.08%
          "      1989   $1752.93 +14.79%   $412.45   23.53%
          "      1990   $1913.03  +9.13%   $482.57   25.23%
          "      1991   $1779.11  -7.00%   $464.81   26.13%
     Tom Davis-R 1992   $1826.46  +2.66%   $471.23   25.80%
          "      1993   $1824.27  -0.12%   $471.23   25.83%
          "      1994   $1824.27   0       $471.23   25.83%
   Kate Hanley-D 1995   $1886.98  +3.44%   $487.43   25.80%
          "      1996   $2000.07  +5.99%   $487.43   24.37%
          "      1997   $1998.44  -0.08%   $503.67   25.20%
          "      1998   $1998.44   0       $503.67   25.20%
          "      1999   $1998.44   0       $503.67   25.20%
          "      2000   $2123.17  +6.24%   $534.67   25.18%
          "      2001   $2441.63 +15.00%   $595.04   24.37%
          "      2002   $2955.38 +21.04%   $695.52   23.53%
          "      2003   $3185.20  +7.78%   $754.46   23.69%
Gerry Connolly-D 2004   $3413.19  +7.16%   $799.73   23.43%
          "      2005   $3753.75  +9.98%   $825.00   21.98%
          "      2006   $4281.44 +14.07%   $894.73   20.90%
          "      2007   $4281.44   0       $959.12   22.40%
          "      2008   $4425.59  +3.37%  $1004.77   22.70%
 Sharon Bulova-D 2009   $4396.65  -0.65%   $958.76   21.81%
          "      2010   $4294.60  -2.32%   $950.56   22.13%
          "      2011   $4690.11  +9.21%  $1045.56   22.29%
          "      2012   $4658.44  -0.68%  $1029.02   22.09%
          "      2013   $5080.52  +9.06%  $1051.02   20.69%
          "      2014   $5547.46  +9.19%  $1139.88   20.55%
          "      2015   $5783.11  +4.25%  $1165.95   20.16%
          "      2016   $6243.39  +7.96%  $1212.57   19.42%
          "      2017   $6422.76  +2.87%  $1244.72   19.38%
          "      2018   $6837.56  +6.46%  $1299.92   19.01%
          "      2019   $6984.07  +2.14%  $1327.77   19.01%
    Jeff McKay-D 2020   $7159.35  +2.51%  $1361.09   19.01%
          "      2021   $7452.66  +4.10%  $1413.05   18.96%
          "      2022   $7812.16  +4.82%  $1400.52   17.93%
— David Swink, FCTA board member / Updated 2022-07-02


