
The Unclear Future for Gifted-and-Talented Education
Controversy has ramped up around the practice of providing accelerated classes for selected students, raising questions about how programs will look in coming years
By Ben Chapman
8/13/2022
Will gifted-and-talented school programs still exist in five years?
Controversy has ramped up around the longtime practice of providing accelerated classes for selected students. Racial-justice movements highlighted inequalities, prompting changes in districts across the nation. Lawsuits related to these programs are pending in states including Virginia, Missouri and New York.
Critics say gifted-and-talented classes lead to racial segregation and take resources away from other students who need them. Even some proponents say changes may be needed in methods for selecting students and in the names of these programs, which many brand as elitist.
Backers argue they are a strong selling point for public education, especially to middle-class families, and play a valuable role in educating students. Some say advances in assessing the ways that children learn, which have been helped by new technology, point toward a need for more tailored instruction, not less.
There’s a greater and greater understanding of the individual learning needs of students, across the board,” says Scott Peters, a research scientist at the Center for School and Student Progress at Portland, Ore.-based Northwest Evaluation Association, a nonprofit that creates tests used in schools around the world. “It’s going to be harder and harder to support these ideas of, oh, let’s just have all ninth-graders learn algebra.”

Gifted and talented programs are mostly managed locally, and their content varies widely. There is no direct federal funding for them. Most states have gifted programs, but only 15 mandate them and provide funding, according to the National Association for Gifted Children. Most don’t provide guidance on how to identify gifted students, how they should be taught, or at what ages they should enter the programs. Students chosen as gifted may get accelerated lessons in classrooms shared with others not in the program, or in separate classes or schools.
New York City, the largest school district in the nation, is in the midst of a particularly heated debate. Mayor Eric Adams this year expanded gifted classes to every district in the city, just months after his predecessor moved to do away with them. The plan adds 1,000 seats to gifted classes for third graders and 100 seats for kindergarten students this fall.
At the same time, Mr. Adams got rid of an admissions test that opponents of these programs had criticized as favoring white and Asian children over Black and Hispanic students. Instead, students will be referred by teachers.
Expanding rather than eliminating the programs is a way to encourage enrollment after declines during the pandemic, says New York City Chancellor David Banks. Universal screening of third-grade students for gifted eligibility will increase diversity, he adds. “Don’t throw the baby out with the bathwater.”
Some see this model of scrapping admissions tests and offering accelerated classes in every school as one that could take root more widely across the U.S. in coming years.

RSVP
Many parents want the option of gifted programs for their kids, and the classes can be important in educating talented students, says Johns Hopkins University professor Jonathan Plucker, a past president of the National Association for Gifted Children. But, to survive, he says, the programs need an overhaul and likely a name change as well.
“I think, for some people, the term brings lots of raw feelings about elitism,” Dr. Plucker says. “Opportunities that they feel that they were unfairly denied when they were growing up.”
Critics say the programs feed racial and wealth inequalities. Students in wealthier schools were more than twice as likely to enroll in gifted education programs compared with those in high-poverty schools, according to a 2021 study published in the Journal of Advanced Academics. A 2018 study conducted by the University of Connecticut found that students living in poverty were less likely than other children to be identified as gifted.
White students accounted for 58% of enrollment in gifted programs, although they made up 47% of enrollment in the nation’s public school system, according to nationwide data for the 2017-18 school year collected by the Department of Education.
Brooklyn school-board leader NeQuan McLean says gifted programs have caused division and segregation in his district, and should be abolished because they take resources away from needy students.
硅谷 101 — 有趣的前沿科技深度视频
“We need to teach all students, including those students who may not be gifted in math, but may be talented in art,” says Mr. McLean, president of Community Education Council 16 in the Bedford-Stuyvesant neighborhood. “We have to make sure that we’re tapping into all of those things.”
How students are selected for gifted programs is an issue at the heart of the debate. New York City’s test was criticized in part because families could hire tutors to prepare. Education Department officials say the new system based on teacher recommendations will yield more diverse admissions.
Meanwhile, a National Bureau of Economic Research study of a single large district in an unnamed city published in 2015 found that testing all students for giftedness, rather than relying on teacher recommendations, resulted in a more diverse group of students qualifying.
Local conflicts over access to gifted programs have become more widespread as the nation navigates a period of social change, Dr. Plucker says. The acrimony, he says, has led many educational leaders to want to get rid of the programs altogether.
But the drawbacks of deprioritizing programs for the nation’s talented children could be huge, he says. “We need to get this right, or else we’re all going to pay for it down the line.”
Turbocharged: Car Tax Burden Rises
Bill Tracy | Bacon’s Rebellion
8/13/2022
Fairfax County just mailed out its 2022 car tax bills, and the tax increase is substantial.
The Board of Supervisors granted us a 15% discount off of the inflated 2022 Blue Book vehicle values. That’s nice, but it looks like the Board failed to mention that the car tax was increasing for a second reason: the “subsidy” was reduced for the first $20K value of the car.
Here are some car tax facts for my personal vehicle.
Base Case (2021):
- Bill’s 2020 RAV4 Value 2021: $23,725
- Tax Before Relief: $1,084
- Tax Relief/Subsidy (Under $20k Value): $525
- Net Car Tax Owed 2021: $558
Tax Increase (2022):
- Bill’s 2020 RAV4 Inflated Value 2022 (Less 15%): $27,073
- Tax Before Relief: $1,237
- Tax Relief/Subsidy (Under $20k Value): $452
- Net Car Tax Owed 2022: $785

Last year I predicted (incorrectly) that I would owe a total of only $425 in car tax for 2022. Thus, I owe about $360 more than I predicted, of which +$73 is due to the reduction in the under $20k “subsidy,” and the rest is due to inflation. In short, my 2022 car tax bill is not quite double the expected amount.
But I am a cheapskate. Reportedly, the average new car cost now is $47,000. That implies some NoVA residents must pay car taxes over $2,000 per year, per new vehicle, not including sales tax, and not including HUF fees for green cars.
It’s good thing Michael Vick, known for owning a fleet of expensive cars, left the state a few years ago. Otherwise, he could owe Virginia some huge back car taxes!
Bill Tracy, a retired engineer, lives in Northern Virginia.
硅谷 101 — 有趣的前沿科技深度视频
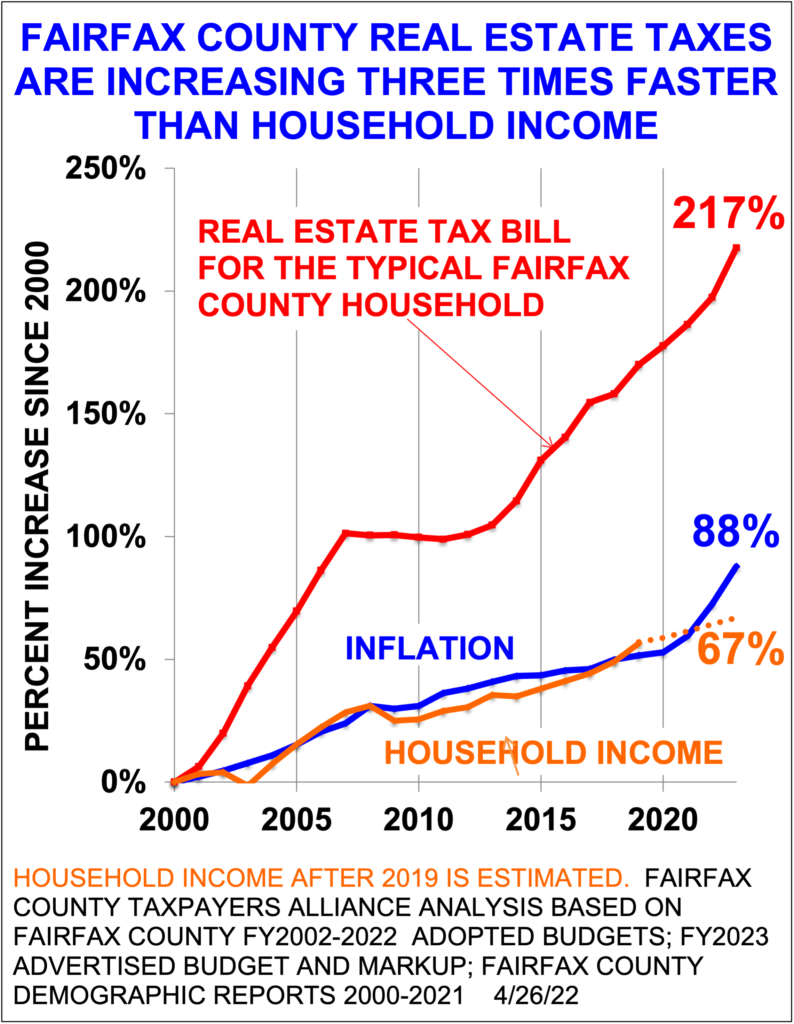
Fairfax County Homeowners to Get a $600 (8%) Tax Hike
By Arthur Purves
7/19/2022
Taxation by Misrepresentation
Around June 28 Fairfax County homeowners will get their real estate tax bill, which is due July 28. The typical homeowner’s real estate tax bill will increase by $484 or 6.8%, from $7,159 to $7,643.
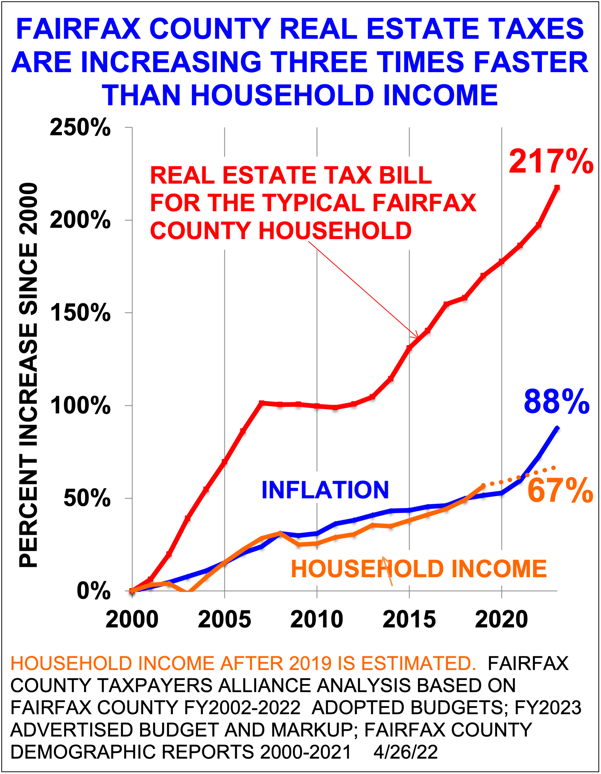
Around Sept. 5, Fairfax County car owners will get their personal property tax bill, which is due Oct. 5. The typical household’s personal property tax will increase by $151 or 36%, from $420 to $571.
Combining real estate and property tax increases, the typical household will have a $634 or 8.4% tax increase. This is the largest increase since Gerry Connolly’s 9.7% increase in 2006, at the end of the housing bubble. (When he was county chairman, Congressman Connolly increased taxes 15% in 2003, which makes him the record holder for the largest tax increase since 1982.)
However, if you read county chairman Jeff McKay’s April 26, 2022, newsletter about next year’s budget, you’d think your taxes are going down.
First, he says that the supervisors lowered the tax rate 3 cents, from $1.14 to $1.11. In fact, the supervisors increased the tax rate, since $1.11 is 7 cents higher than the $1.04 rate which would have prevented a tax increase due to higher assessments.
Virginia Code Section 58.1-3321 requires supervisors to compare the new rate of $1.11 not to the current $1.14 rate but to a lower rate that would offset the increase in assessments. For homeowners that “lowered” rate is $1.04. Chairman McKay ignores the Virginia Code.
Also, Chairman McKay left out the storm water tax, which is also based on assessments. The storm water rate is 3 ¼ cents, so the total real estate tax rate is $1.14 ¼ cents, and not $1.11.

Second, Chairman McKay says, “The Board also agreed to a 15% reduction in the assessment of personal property (car tax), …” However, used car values have increased so much that even with this 15% “reduction”, the typical household’s car tax bill will increase 36%.
Third, Chairman McKay cites “expanded tax relief for seniors,” which will increase the number of seniors eligible for tax relief by 2,000. There are about 160,000 seniors in the county, so the expanded tax relief benefits only about 1% of seniors.
Under compensation, Chairman McKay says all county employees are getting 4% raises. However, the supervisors’ budget package states that there will be “… average pay increases of 7.86 percent for uniformed public safety employees and 6.16 percent for non-uniformed employees …”
All told, county revenue increases next year total $246 million. The total cost of raises and rate hikes for benefits for the county and schools (school employees are also getting 6% raises) is $252 million. So, the quarter-of-a-billion-dollar tax hike is all for raises and benefits.

Chairman McKay’s newsletter does not mention this. Instead, he says, “In total, this budget provides $199.4 million in tax relief.
This is taxation by misrepresentation.
What he means is that the supervisors were thinking of raising taxes and other revenues by $445 million, but instead they only raised taxes and revenues by $246 million.
Suppose Chairman McKay had said that the supervisors effectively raised the real estate tax rate 7 cents rather than decreasing it 3 cents; that the rate is actually $1.14, not $1.11; that the car tax is going up 36%, not down 15%, that county employees are getting raises of 6% and 7%, not 4%, and that county revenues are increasing $246 million to pay for the raises and not going down by $199 million.
Would that jeopardize Chairman McKay’s reelection next year?

Fairfax County, Vienna Real Estate Taxes Over Last 40 Years
By David Swink
7/02/2022
This FCTA board member has lived in the same southwest Vienna rambler since Dec 1975 — with no improvements made which would alter its accessed value for tax purposes. So my home can serve as a baseline for judging the actual growth of real estate taxes in both Fairfax County and Town of Vienna for the period from 1976 onward.
We’re all familiar with FCTA’s graph of Fairfax County real estate tax increases since FY2000. But here is raw data going back another 25 years — in actual dollars (not noting inflation).

A column is provided showing the County real estate tax percent increase from the previous year. Another column shows Vienna’s real estate tax as a percentage of the county’s, to see if Vienna’s numbers track with those of the county. So what does one notice? Even without a graph, one can deduce the following:
- Both Fairfax County and Vienna taxes “took off” after year 2000, leveled during the Great Recession, and are now back on full throttle.
- The Vienna percentage is fairly consistently in the low-to-mid 20’s, and thus seems more tied to county increases than to actual need.
- Oddly, the raw tax increase (not adjusted for inflation) from 1976 to 2013 is precisely a factor of 6.18 for both the county and Vienna.
Numbers for future years will be added to the table as they become available. Also, information such as the political make-up of the Fairfax County Board of Supervisors for each period may be added. Enjoy.

 BOS Chairman   Year  Fx Co Tax  Yr-Yr  Vienna Tax  Vn/Fx
  Jack Herrity-R 1976    $821.72   -       $170.01   20.69%
          "      1977    $857.91  +4.44%   $177.50   20.69%
          "      1978    $872.97  +1.76%   $175.66   20.12%
          "      1979    $884.27  +1.29%   $178.00   20.13%
          "      1980    $980.98 +10.94%   $197.47   20.13%
          "      1981   $1077.23  +9.81%   $235.42   21.85%
          "      1982   $1164.02  +8.06%   $261.31   22.45%
          "      1983   $1164.02   0       $261.31   22.45%
          "      1984   $1217.13  +4.56%   $275.10   22.60%
          "      1985   $1216.67  -0.04%   $288.85   23.74%
          "      1986   $1232.69  +1.32%   $292.19   23.70%
          "      1987   $1354.12  +9.85%   $318.01   23.48%
  Audrey Moore-D 1988   $1554.41 +14.79%   $358.71   23.08%
          "      1989   $1752.93 +14.79%   $412.45   23.53%
          "      1990   $1913.03  +9.13%   $482.57   25.23%
          "      1991   $1779.11  -7.00%   $464.81   26.13%
     Tom Davis-R 1992   $1826.46  +2.66%   $471.23   25.80%
          "      1993   $1824.27  -0.12%   $471.23   25.83%
          "      1994   $1824.27   0       $471.23   25.83%
   Kate Hanley-D 1995   $1886.98  +3.44%   $487.43   25.80%
          "      1996   $2000.07  +5.99%   $487.43   24.37%
          "      1997   $1998.44  -0.08%   $503.67   25.20%
          "      1998   $1998.44   0       $503.67   25.20%
          "      1999   $1998.44   0       $503.67   25.20%
          "      2000   $2123.17  +6.24%   $534.67   25.18%
          "      2001   $2441.63 +15.00%   $595.04   24.37%
          "      2002   $2955.38 +21.04%   $695.52   23.53%
          "      2003   $3185.20  +7.78%   $754.46   23.69%
Gerry Connolly-D 2004   $3413.19  +7.16%   $799.73   23.43%
          "      2005   $3753.75  +9.98%   $825.00   21.98%
          "      2006   $4281.44 +14.07%   $894.73   20.90%
          "      2007   $4281.44   0       $959.12   22.40%
          "      2008   $4425.59  +3.37%  $1004.77   22.70%
 Sharon Bulova-D 2009   $4396.65  -0.65%   $958.76   21.81%
          "      2010   $4294.60  -2.32%   $950.56   22.13%
          "      2011   $4690.11  +9.21%  $1045.56   22.29%
          "      2012   $4658.44  -0.68%  $1029.02   22.09%
          "      2013   $5080.52  +9.06%  $1051.02   20.69%
          "      2014   $5547.46  +9.19%  $1139.88   20.55%
          "      2015   $5783.11  +4.25%  $1165.95   20.16%
          "      2016   $6243.39  +7.96%  $1212.57   19.42%
          "      2017   $6422.76  +2.87%  $1244.72   19.38%
          "      2018   $6837.56  +6.46%  $1299.92   19.01%
          "      2019   $6984.07  +2.14%  $1327.77   19.01%
    Jeff McKay-D 2020   $7159.35  +2.51%  $1361.09   19.01%
          "      2021   $7452.66  +4.10%  $1413.05   18.96%
          "      2022   $7812.16  +4.82%  $1400.52   17.93%
— David Swink, FCTA board member / Updated 2022-07-02


客服电话:1 (888) 666-7723
客服邮箱:customerservice@huarenstore.com