
美国亚裔人口研究报告最新出炉:华裔人数最多!印度裔受教育程度、收入最高!
By 加凯出国
5/25/2021
作为传统移民大国,美国移民状况在很大程度上影响着美国的人口变化。
近日美国著名研究机构Pew Research公布了“美国亚裔生存现状报告”。正好5月是美国亚太裔传统月,再加上前段时间#StopAsianHate运动,借着这次的研究报告是个不错的时机来了解一下美国亚裔的生存现状。
根据该报告关于美国人口普查局的最新数据分析显示,在2000年至2019年间,亚裔人口激增了81%,亚裔人口的增长率是美国所有族裔中最快的。
现在美国亚裔人口数量已到达破纪录的2300万人,按这个趋势发展下去到2060年美国亚裔人口将达到4600万人,届时亚裔将赶超其他族群成为美国最大的移民群体。
Pew Research预测,到2065年外来移民及其后代子女将占美国人口增长的88%,成为未来半个世纪美国人口增长的主要推动力。
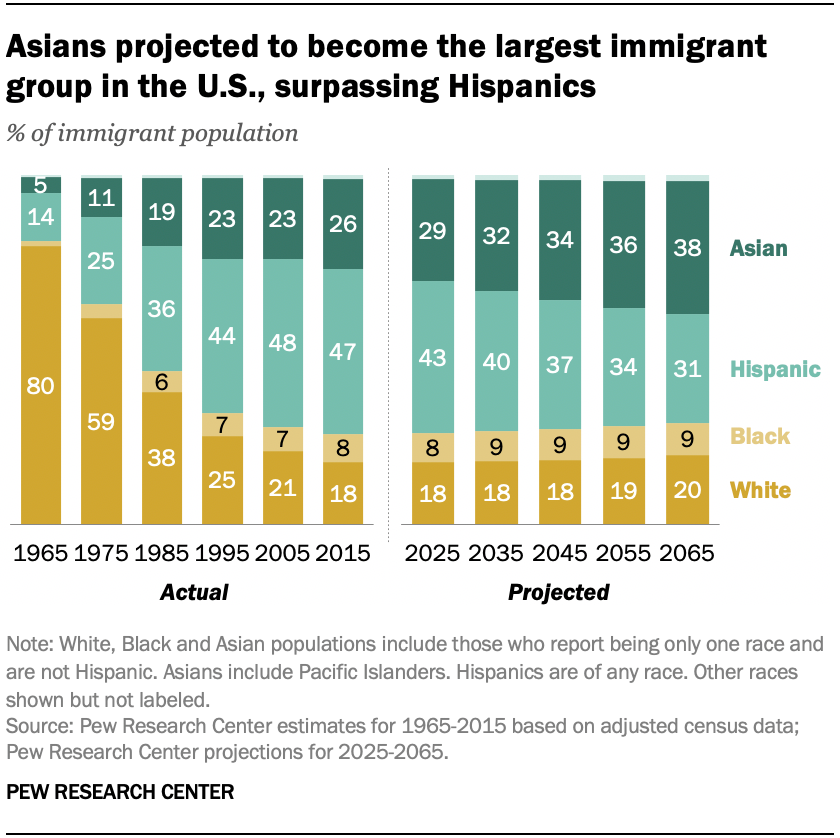
特别是到2055年,亚裔移民有望超过拉美裔成为美国最大的移民群体。这也一定程度说明了,在美亚裔人口增长率最快的重要原因所在——移民的大量输入。
多年来,凭借领先的经济环境和优质的教育资源等优势,美国一直是全球意向移民者的首选之地。那么,亚裔移民为何能在移民大军中脱颖而出?亚裔移民群体又有哪些特征呢?

Tel: 551-580-4856 | Email: F.WINNIE.S@GMAIL.COM
01
华裔人口最多
在美国共有19个主要的亚裔血统族群,这19个主要亚裔血统占到整个美国亚裔人口总数的97%。
在1870年的人口普查中,当时美国人口普查局只统计了6.3万亚裔。到1960年人口普查受访者首次可以自己选择申报自己的种族种类,当时有98万人口选择了亚裔族群。
亚裔人口从2000年的1190万几乎翻了一倍在2019年达到2320万,十九年间增长了95%,现在亚裔人口占美国总人口的7%。

单一种族血统是亚裔人口中人数比例最大的,他们也是美国人口增速最大的族群,2000年到2019年间,这部分人口增长了81%,排名第二的是增速为70%的拉丁美裔,同期内美国非裔人口增长了20%,而美国第一大人口白人几乎没有什么变化。
美国华裔是美国最大的亚洲血统群体,占整个美国亚裔人口的23%,人数为540万人。
接下来两个最大的两个亚裔族群是印度裔和菲律宾裔,印度裔和菲律宾裔人口分别为460万人和420万人,占美国亚裔总数的20%和18%。
越南裔、韩国裔和日本裔紧随其后,人口总数分别为220万、190万和100万。
剩余的13个亚裔血统族群占美国亚裔总人口的12%,人数在2700万左右,但没有一支总人口超过60万。

02
印度裔最富有
总体来看亚裔在美国的经济福祉方面表现良好,优于美国总体人口的平均水平,但亚裔内部差异很大。
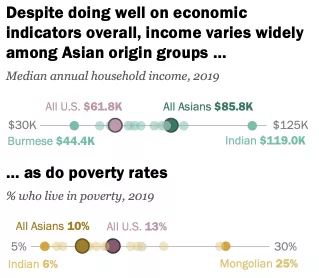
2019年亚裔家庭的收入中位数为85,800美元,而美国家庭的平均年收入为61,800美元。
外国出生的亚洲家庭的收入略高于美国出生的亚洲家庭的收入,分别为8.8万美元对8.5万美元。
但是这个总体数字掩盖了不同亚裔族群之间的差异。例如,以缅甸裔美国人为首的家庭收入明显低于美国亚裔的整体收入,他们之间的差距是4.44万美元对8.58万美元。
相比之下,只有两个亚洲血统群体的家庭收入高于美国亚裔的平均收入:11.9万美元的印度裔和9.04万美元的菲律宾裔。
亚裔群体中贫困率也存在很大差异,大多数亚裔血统族群的贫困率都高于美国平均水平,其中蒙古裔的贫困率最高,印度裔贫困率最低。
年龄在25岁以上的亚裔族群中,有一半以上拥有大学本科学历或更高学历,而同一年龄段的美国人口中这一比例仅为33%。25岁及以上的印度裔在美国亚裔中受教育程度最高,2019年有75%的印度裔拥有学士学位或更高学历,而不丹裔成年人是拥有大学学历最低的亚洲裔族群。
03
西海岸亚裔最扎堆
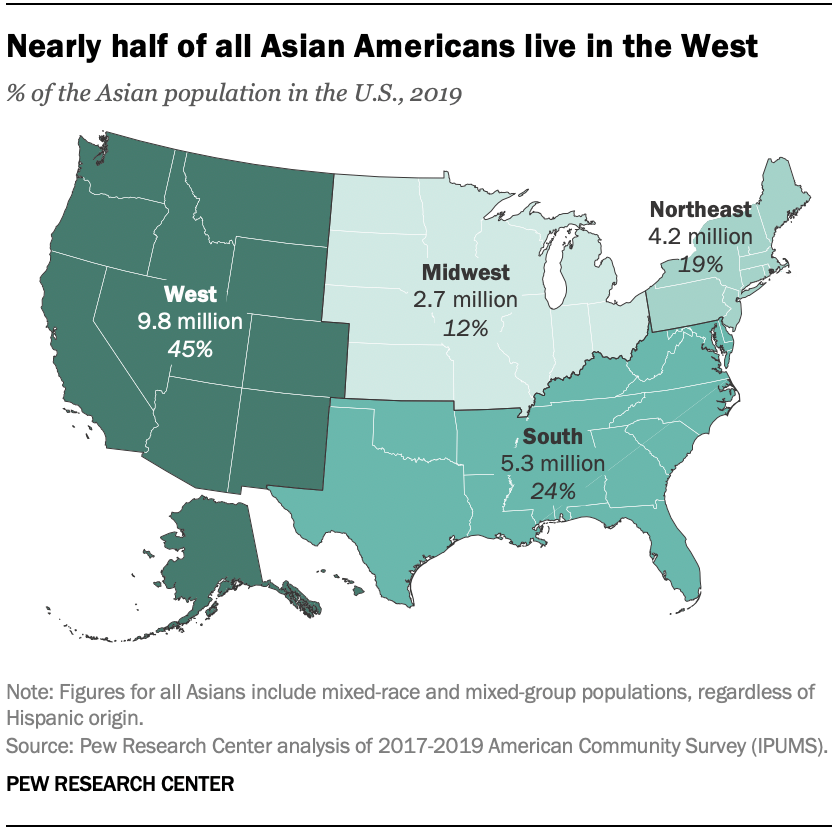
美国亚裔人口中有45%都生活在西海岸,仅加州一州就有30%的亚裔人口,670万美国亚裔居住在加州,其次是有着190万亚裔人口的纽约州、160万亚裔人口的得克萨斯州、95.8万亚裔的新泽西州和85.2万的华盛顿州。
55%的美国亚裔人口都生活在上述五个州内。
除了夏威夷州,亚裔在加州、华盛顿州、新泽西州和内华达州所占总人口比例最高,分别为17%、11%、11%和11%。
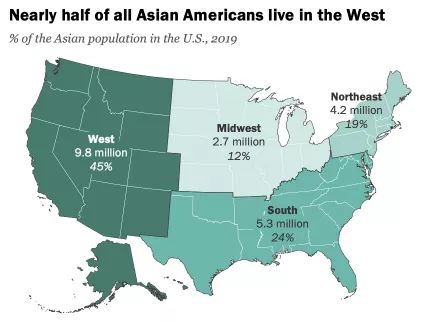
生活在美国西部、南部、东北部和中西部的亚裔人口分别为45%、24%、19%和12%。
04
在家说中文的亚裔人数最多
大约有57%的美国亚裔人口出生在美国之外的国家,其中出生在美国之外的成人亚裔人口占71%。相比较来看,出生在美国之外总人口和成人人口的比例分别为14%和17%。
自1965年以来,来自亚洲的移民人数占到了美国总体移民人口的四分之一,但亚裔们到达美国的时间和方式都不尽相同,这也就解释了为什么有的亚裔族群出生在美国的比例更高,有的就很低。
例如,美国日本裔很多是在19世纪以种植园工人的身份移民到了夏威夷,所以这个族群后裔出生在美国的比例就很高,而不丹国的大量移民都是以难民身份进入美国的,这就为什么这个族裔有高达85%的外国出生率。
2017年来自亚洲的无身份移民占全美1050万无身份移民总数的14%,其中以来自印度、中国、菲律宾和韩国四个国家的无身份移民数量最多。
截止到2019年美国亚裔中有72%的人口精通英语,而出生在海外的亚裔中只有57%的人口精通英语。
有34%的亚裔会在家里只说英语,其余的66%会在家里说英语之外的其他语言,最常见的是占比34%的中文,这包括普通话和粤语。印地语是除中文之外亚裔在家使用的第二大语种,占比为12%,之后是9%的菲律宾语系及7%的越南语。在美国出生的亚洲人中,近65%的家庭只说英语。

看完这些数据,你是不是也惊叹于亚裔在美国社会的发展力量?
Key facts about Asian Americans, a diverse and growing population
BY ABBY BUDIMAN AND NEIL G. RUIZ
5/25/2021
The U.S. Asian population is diverse. A record 23 million Asian Americans trace their roots to more than 20 countries in East and Southeast Asia and the Indian subcontinent, each with unique histories, cultures, languages and other characteristics.
The 19 largest Asian origin groups in the United States together account for 97% of the nation’s total Asian population. Below are key findings about these Americans. (This analysis includes all those who identify their race as Asian alone or as part of a multiracial background, regardless of Hispanic origin. It is accompanied by updated fact sheets that describe key demographic and economic characteristics of each of Asian origin group, as well as by another analysis that details the diversity of origins within the Asian American population.)
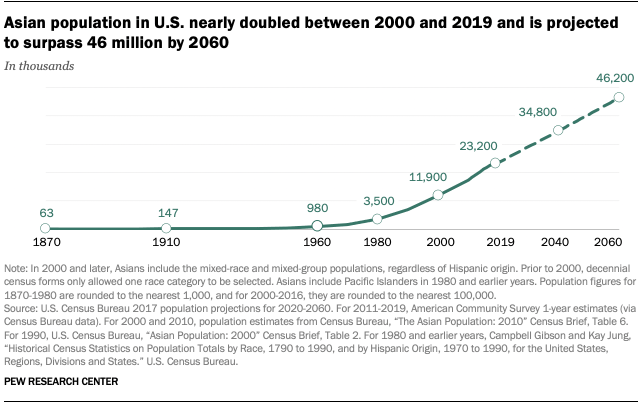
The U.S. Asian population is projected to reach 46 million by 2060. In the 1870 census, roughly 63,000 individuals were classified as Asian by U.S. Census Bureau enumerators. By 1960, the first time census respondents could choose their own race, 980,000 individuals self-identified as Asian. The nation’s Asian population rose to 11.9 million by 2000 and then nearly doubled to 23.2 million by 2019 – a 95% increase within two decades. Asians now make up about 7% of the nation’s overall population, and their numbers are projected to surpass 46 million by 2060, nearly four times their current total. (In decennial censuses conducted in 1980 and earlier, Asian Americans and Pacific Islanders were reported as a single group.)
The single-race, non-Hispanic segment of the U.S. Asian population makes up a large majority (83%) of all Asians in the country. This population is also the nation’s fastest-growing racial or ethnic group. Between 2000 and 2019, their numbers grew by 81%, outpacing a 70% increase among Hispanics. The Black population grew by 20% during this span, while there was virtually no change in the White population.
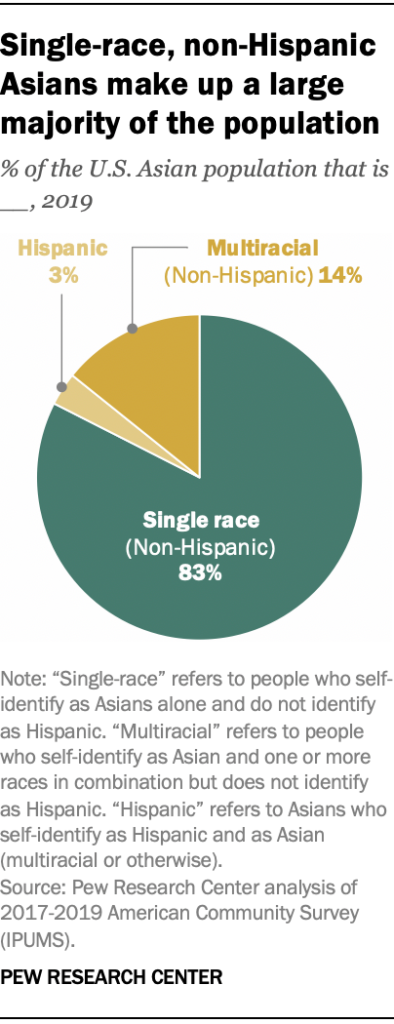
Multiracial and Hispanic Asians comprise 14% and 3% of the Asian population in the U.S., respectively. Those who identify as Asian and White make up a large majority (70%) of non-Hispanic multiracial Asians. Of the 19 origin groups included in this analysis, Japanese Americans are most likely to identify as multiracial non-Hispanic (32% do so). Around one-in-five Filipinos (18%) and 15% of Koreans also identify as multiracial non-Hispanic.
Asian Hispanics, meanwhile, are the smallest segment of the nation’s Asian population. A 34% plurality of this group are Filipino.
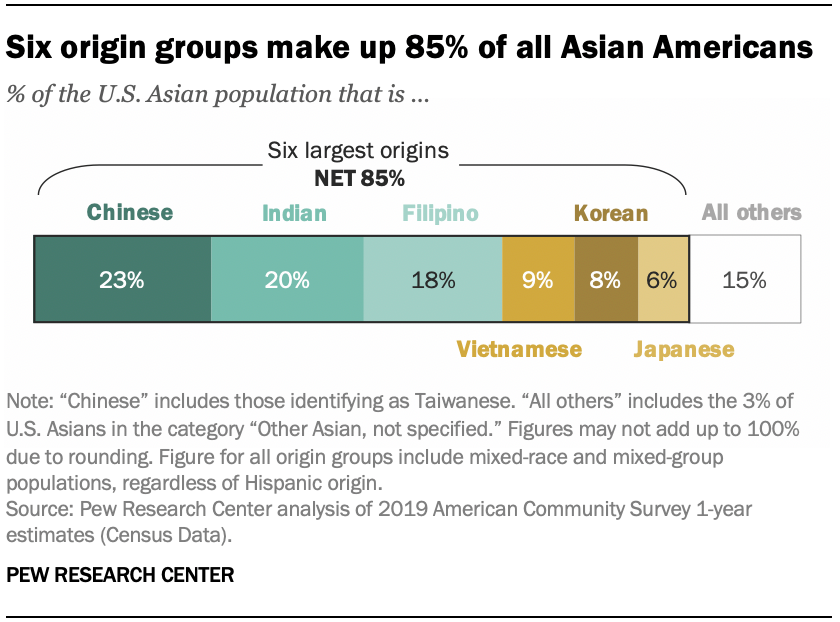

Chinese Americans are the largest Asian origin group in the U.S., making up 23% of the Asian population, or 5.4 million people. The next two largest origin groups are Indian Americans, who account for 20% of the total (4.6 million people), and Filipinos, who account for 18% (or 4.2 million people). Those with roots in Vietnam (2.2 million), Korea (1.9 million) and Japan (1.5 million) each have a population of at least 1 million. The other 13 groups in this analysis account for 12% of all U.S. Asians, totaling 2.7 million people, with no one group surpassing 600,000. The remaining 3% of U.S. Asians provided other origins or indicated they are Asian but did not indicate an origin.
Nearly half of U.S. Asians (45%) live in the West, with nearly a third (30%) in California alone. California had an Asian population of roughly 6.7 million in 2019, by far the nation’s largest. It was followed by New York (1.9 million), Texas (1.6 million), New Jersey (958,000) and Washington (852,000). A majority of U.S. Asians (55%) lived in these five states.
Aside from Hawaii, where U.S. Asians accounted for 57% of the population in 2019, Asians made up the largest share of the overall population in California (17%), Washington (11%), New Jersey (11%) and Nevada (11%).
While a plurality of Asian Americans lived in the West in 2019, some 24% lived in the South, 19% in the Northeast and 12% in the Midwest.
Around six-in-ten Asian Americans (57%), including 71% of Asian American adults, were born in another country. By comparison, 14% of all Americans – and 17% of adults – were born elsewhere.
The modern immigration wave from Asia has accounted for a quarter of all immigrants who have arrived in the U.S. since 1965. But when and how Asian immigrants arrived in the U.S. varies, which helps explain why some Asian origin groups are more likely than others to be U.S. born. For example, immigrants account for only 27% of Japanese Americans, who began arriving in the 19th century as plantation workers in what is now the state of Hawaii. By contrast, many Bhutanese arrived recently as refugees, and a large majority (85%) are foreign born.
Asian Americans are projected to be the nation’s largest immigrant group by the middle of the century. Single-race, non-Hispanic Asians are projected to become the largest immigrant group in the country, surpassing Hispanics in 2055. By then, Asians are expected to make up 36% of all U.S. immigrants, while Hispanics will make up 34%, according to population projections from the Pew Research Center.
People from Asia made up about 14% of the 10.5 million unauthorized immigrants in the U.S. in 2017. Four nations in Asia were among the top 15 countries of birth for U.S. unauthorized immigrants: India (525,000), China (375,000), the Philippines (160,000) and Korea (150,000).
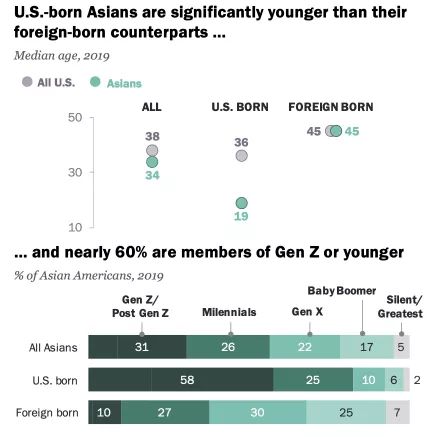
U.S.-born Asians are substantially younger than the rest of the Asian American population. As of 2019, the Asian population in the U.S. had a median age of 34, slightly lower than the nation’s overall median of 38. But the median age of U.S.-born Asians was just 19 – compared with 36 among all U.S.-born people. Foreign-born Asians, meanwhile, had the same median age as the nation’s overall immigrant population (45).
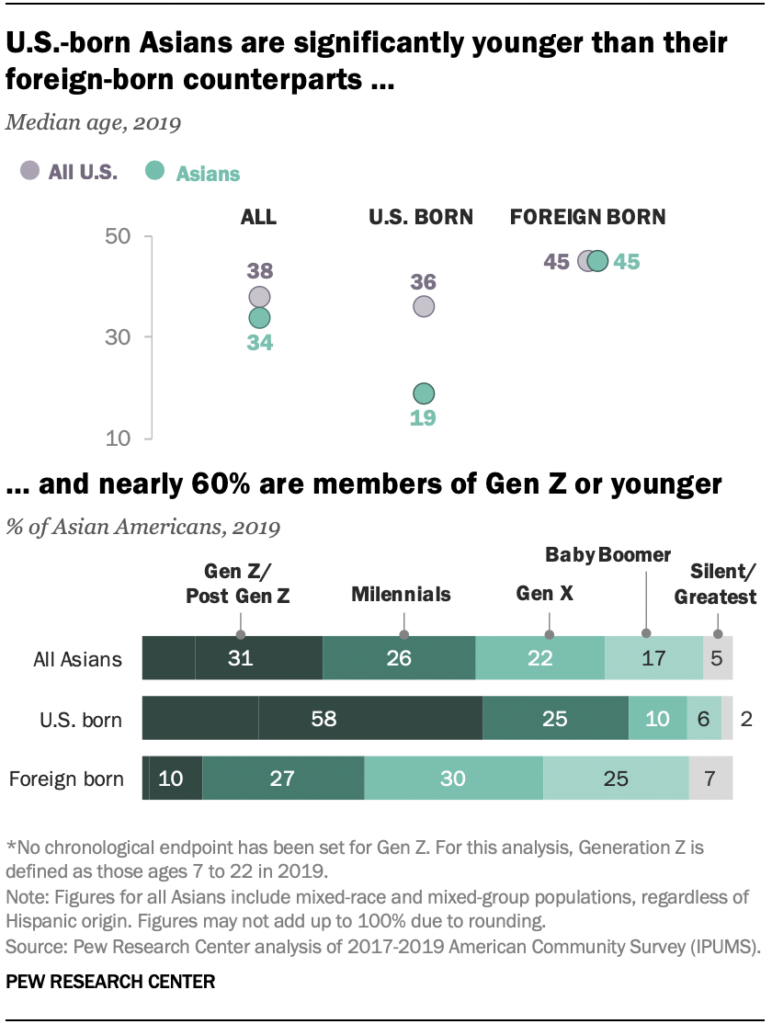
The relative youth of the U.S.-born Asian population is reflected in their generational breakdown. Nearly six-in-ten U.S.-born Asians (58%) were members of Generation Z in 2019, which means they were 22 or younger at the time. Another quarter of the U.S.-born Asian population that year belonged to the Millennial generation, while one-in-ten or fewer were part of Generation X or older generations.
Overall, 72% of all U.S. Asians were “proficient” in English as of 2019, meaning they either spoke only English or spoke the language very well. Nearly all U.S.-born Asians (95%) were proficient in English, compared with 57% of foreign-born Asians.
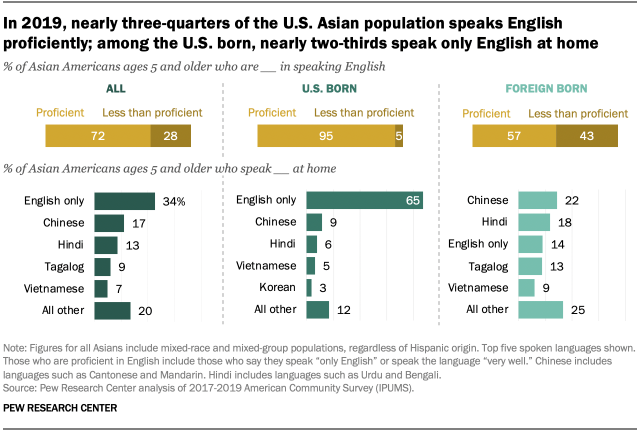
About a third of U.S. Asians (34%) speak only English in their homes. The remaining 66% speak a language other than English at home. The most common of these is Chinese, including Mandarin and Cantonese, spoken by 34% of Asians at home. Hindi (13%) is the second most commonly spoken non-English language among Asians, followed by Tagalog and other Filipino languages (9%) and Vietnamese (7%).
Nearly two-thirds of U.S.-born Asians (65%) speak only English at home. Most Asian immigrants, by contrast, speak a language other than English at home. Chinese is the most commonly spoken language among the foreign-born Asian population (22%), followed by Hindi (18%).
About a quarter of Asian Americans (27%) live in multigenerational households. That’s comparable to the share among all immigrants in the U.S. (28%), but higher than the share among Americas overall (19%). Asians who are immigrants are slightly more likely than U.S.-born Asians to reside in households with multiple generations under one roof (29% vs 23%).
Asians have a lower homeownership rate than the U.S. public overall (59% vs. 64%). Nevertheless, the homeownership rate is on the rise among Asian Americans, increasing from 53% in 2000 to 59% in 2019. Immigrant Asians were slightly more likely than U.S.-born Asians to be homeowners in 2019 (60% vs. 56%). Among the entire U.S. population, however, immigrants were less likely than the U.S. born to own a home in 2019 (53% vs. 66%).
On the whole, Asian Americans do well on measures of economic well-being compared with the overall U.S. population, but this varies widely among Asian origin groups. In 2019, the median annual household income of households headed by Asian people was $85,800, compared with $61,800 among all U.S. households. Foreign-born Asian households earned slightly more than those headed by U.S.-born Asians ($88,000 vs. $85,000).
These overall figures hide differences among Asian origin groups, however. Households headed by Burmese Americans, for example, had significantly lower incomes than Asian Americans overall ($44,400 vs. $85,800). By contrast, only two Asian origin groups had higher household incomes than among Asian Americans overall: those headed by Indian Americans ($119,000) and those headed by Filipino Americans ($90,400).
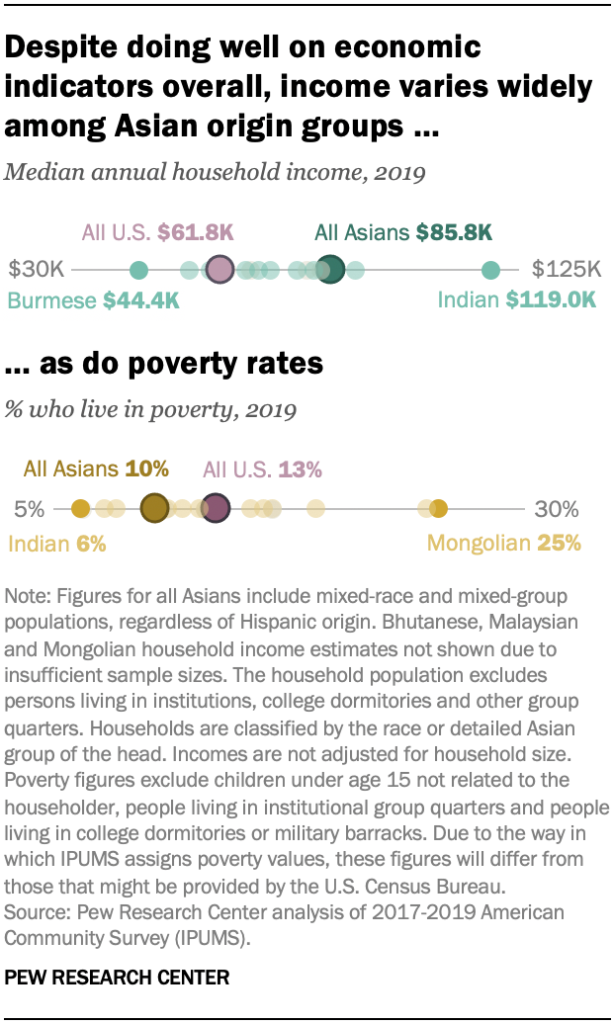
All told, 12 Asian origin groups had higher median household incomes than the median among all Americans.
Asians are less likely than Americans overall to live in poverty (10% vs. 13% as of 2019). Poverty rates among U.S.-born and foreign-born Asians were 9% and 11%, respectively, that year. The poverty rate among immigrant Asian minors – those under the age of 18 – was slightly higher, at 16%.
Again, there are large differences in poverty rates among Asian subgroups. Most of the Asian origin groups analyzed (12 of 19) had poverty rates that were as high as or higher than the U.S. average in 2019. Mongolians (25%) had the highest poverty rates among Asian groups, while the lowest rate was among Indians (6%).
More than half of Asians ages 25 and older (54%) have a bachelor’s degree or more education, compared with 33% of the U.S. population in the same age range. Similar shares of U.S.-born (55%) and foreign-born Asians (54%) have earned a college degree. Both figures are substantially higher than the share of all U.S.-born people and all U.S. immigrants with a college degree (32% each).
As a result, the housing finance marketplace is now more robust and safer than it was 15 years ago. Any dip in the housing market will be cushioned by these stricter regulations.
Factor No. 2: Pandemic Mortgage Forbearance
When the housing market crashed in 2007, the influx of foreclosures pumped housing supply into areas with falling prices and weak labor markets, while also preventing recently foreclosed borrowers from re-entering the market as buyers. According to the Federal Reserve, foreclosures during a time of high unemployment could depress prices, plunging homeowners across the country deeper into negative equity.
However, in the pandemic era, the effects of mass unemployment bear little resemblance to the Great Recession, thanks in large part to forbearance programs that have allowed homeowners to postpone their monthly mortgage payments without suffering penalties.
Much like economic trends within the U.S. Asian population, there are wide disparities among origin groups. Indians ages 25 and older have the highest level of educational attainment among U.S. Asians, with 75% holding a bachelor’s degree or more in 2019. Bhutanese adults are the least likely Asian origin group to have a college degree (15%).
Note: This is an update of a post originally published Sept. 8, 2017. See full methodology here.
Source: https://www.pewresearch.org/fact-tank/2021/04/29/key-facts-about-asian-americans/
Flat-Fee MLS Listing Service in Northern VA

Helping For Sale by Owner (FSBO) & For Rent by Owner (FRBO)
DIY Landlord – Renting out Properties Safer and Quicker!
By David Chen
4/15/2021
Q. We purchased our first home some years ago, and are about to move to another home. We are considering to keep our first home as an income property. We heard of the free ads on CRAIGSLIST and zillow.com, but some landlord friends told us it could be a challenge to find qualified tenants through CRAIGSLIST and zillow.com. Is there any way to rent our property out quicker and safer with minimum cost? We are the kind of persons who would like to try things ourselves, and have some spare time.
A. You may have already done the initial research and have figured out the range of monthly rent of your property.
If the monthly rent is low such as $1600.00 or below, you may want to do it through CRAIGSLIST, https://postlets.com/, zillow.com, or similar web sites. The renters interested in the low-priced rentals may not go to the Realtors community for assistance.
If the monthly rent is $1600.00 or above, you may want to consider listing your rental on brightmls.com for the Realtors community to market it for you.
Bright MLS is made up of nine forward thinking MLSs (43 Associations) in the Mid-Atlantic region who put aside their differences and came together with a shared vision to help solve MLS market overlap and empower everyone to get more out of the MLS. Bright will serve parts of 6 states plus Washington, D.C. encompassing 85,000 real estate professionals who serve over 20 million consumers and facilitate approximately 250,000 transactions a year that are valued at more than $70 billion.

Dozens of public real estate websites (such as: zillow.com, redfin.com, brightmlshomes.com, etc.) pull data from brightmls.com through syndication. In a few hours, your listing will show up on dozens of websites and will get the maximum exposure. It is a lot quicker and safer finding qualified tenants than doing it through CRAIGSLIST and zillow.com. You may talk with a Realtor for assistance. Please be aware some Realtors take rental jobs, some don’t.
Over the years I have helped some landlords in the community renting their properties out with very low cost. A popular arrangement is to help the landlords ‘DIY’, which has been working well for those experienced landlords.
The good side of ‘DIY’ is that the landlords can ‘screen’ the potential tenants from the very beginning, have 100% control of the whole process, and enjoy the feeling of “on top of things”.
If you prefer minimum service, I can help you ‘DIY’:
1. I provide CMA, list your rental on brightmls.com, put a realtor’s lockbox at the front door if needed, provide the access log (if needed), support you through the whole process.
I charge a flat fee for the minimum service.
2. If you would like me to prepare the lease or review the lease, there is another reasonable flat fee. This service is optional.
3. You answer phone calls, work with the tenant (if the tenant doesn’t have an agent) or the tenant’s agent, run credit check, verify employment, check references, etc.. You pay the tenant’s agent (if there is one) directly on the move-in date – usually 25% of first-month rent.
If you need full-service, the commission is first-month rent – which includes the commission to be paid to the tenant’s agent.
If you need any customized service (between minimum service and full-service), we can work out an agreement.
Some information:
CMA stands for Comparable (some called Competitive) Market Analysis, that will help you determine the market value of your property for sale or for rent.
I use Sentry-key lockbox. Any Realtor with membership of NVAR (Northern Virginia Association of Realtors) or any other VA Realtors association can access and show the property.
The access log tells when the agents enter the property and their contact info. which can help you follow up with the agents.
If you like the DIY experience, I would recommend you to use the minimum service.
Please feel free to reach me if you need any assistance.
—
David Chen
Realtor (Licensed in VA) | Neighborhood Specialist (McLean, Falls Church, Vienna)
Libra Realty, LLC
dchenj@gmail.com
703-395-5406
WeChat ID: dchenj2015

Last update: 4/15/2021
Websites that will show your flat fee mls listings
4/15/2021
Almost all real estate websites that offer the ability to search brokerage listings use a data feed from the MLS called Internet Data Exchange (IDX) to pull in listing data. Depending on the number of sites tapping into your MLS, your listing could appear on hundreds of websites. We do not control the content of any of the websites listed below. updated periodically & subject to change at any time Here are some examples of national websites by area that pull listings from the MLS:
This block contains unexpected or invalid content.Attempt Block Recovery
- Zillow
- Trulia
- Move.com
- MSN.com
- REALTOR.com
- REMAX.com (in markets where they have an office)
- ZipRealty.com (in markets where they have an office)
- Yahoo.com / Prudential (in markets where they have an office)
- Google Base
- Redfin
- Yahoo Classifieds
- AOL Real Estate
- HomeGain
- Lycos
- Oodle
- Hotpads
- HomeSeekers
- ColdwellBanker.com
- Cenutry21.com
- HouseFront
- CondoQuickFind
Here are just a few examples of local media websites that pull listings from the MLS in their area:
- AZCentral.com (Phoenix, Arizona)
- Chron.com (Houston, Texas)
- DallasNews.com (Dallas/Fort Worth, Texas)
- DenverPost.com (Denver, Colorado)
- LATimes.com (Los Angeles, California)
- MySA.com (San Antonio, Texas)
- RGJ.com (Reno, Nevada)
- SignOnSanDiego.com (San Diego, California)
- StarBulletin.com (Honolulu, Hawaii)
- Tucson.com(Tucson, Arizona)

Here are just a few examples of local brokerage websites that pull listings from the MLS in their area:
- BishopRealty.com (Payson, Arizona)
- Boulderco.com (Boulder, Colorado)
- C21MoneyWorld.com (Las Vegas, Nevada)
- ColdwellBanker-Idaho.com (Coeur d’Alene, Idaho)
- Ebby.com (Dallas, Texas)
- Floberg.com (Billings, Montana)
- LongRealty.com (Tucson, Arizona)
- SantaFeSIR.com (Santa Fe, New Mexico)
- TB.com (Spokane, Washington)
Additionally, here are just a few examples of local REALTOR® Boards or MLS’s that have a public view portal. (Not all boards have this feature):
- ABQREALTORS.com (Albuquerque, New Mexico)
- AlaskaRealEstate.com (Anchorage, Alaska)
- AustinHomeSearch.com (Austin, Texas)
- HAR.com (Houston, Texas)
- HavasuRealtors.com (Lake Havasu City, Arizona)
- HICentral.com (Honolulu, Hawaii)
- mlslistings.com (San Jose, California)
- SFAR.com (Santa Fe, New Mexico)
- TARMLS.com (Tucson, Arizona)
These are just examples. Your listing could literally show up at hundreds of other websites.
Source: https://www.congressrealty.com/Flat-Fee-MLS-Listings/Sites-with-Listings/default.aspp